Global Warming
Bombshell
A prime piece of evidence linking
human activity to climate change
turns out to be an artifact of poor
mathematics
Richard A. Muller
mirrored from
Technology for Presidents
October 15, 2004
Progress in
science is sometimes made by great discoveries. But science also advances
when we learn that something we believed to be true isn't. When solving a
jigsaw puzzle, the solution can sometimes be stymied by the fact that a wrong
piece has been wedged in a key place.
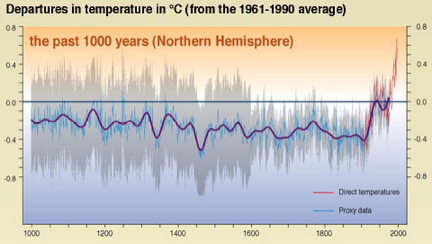
In the
scientific and political debate over global warming, the latest wrong piece may
be the "hockey stick," the famous plot (shown below), published by
University of Massachusetts geoscientist Michael Mann and colleagues. This plot
purports to show that we are now experiencing the warmest climate in a
millennium, and that the earth, after remaining cool for centuries during the
medieval era, suddenly began to heat up about 100 years ago--just at the time
that the burning of coal and oil led to an increase in atmospheric levels of
carbon dioxide.
I talked about
this at length in my December 2003 column. Unfortunately, discussion of this plot
has been so polluted by political and activist frenzy that it is hard to dig
into it to reach the science. My earlier column was largely a plea to let
science proceed unmolested. Unfortunately, the very importance of the issue has
made careful science difficult to pursue.
But now a
shock: Canadian scientists Stephen McIntyre and Ross McKitrick have
uncovered a fundamental mathematical flaw in the computer program that was used
to produce the hockey stick. In his original publications of the stick, Mann
purported to use a standard method known as principal component analysis, or
PCA, to find the dominant features in a set of more than 70 different climate
records.
But it wasn't
so. McIntyre and McKitrick obtained part of the program that Mann used, and
they found serious problems. Not only does the program not do conventional PCA,
but it handles data normalization in a way that can only be described as
mistaken.
Now comes the
real shocker. This improper normalization procedure tends to emphasize any data
that do have the hockey stick shape, and to suppress all data that do not. To
demonstrate this effect, McIntyre and McKitrick created some meaningless test
data that had, on average, no trends. This method of generating random data is
called "Monte Carlo" analysis, after the famous casino, and it is
widely used in statistical analysis to test procedures. When McIntyre and
McKitrick fed these random data into the Mann procedure, out popped a hockey
stick shape!
That discovery
hit me like a bombshell, and I suspect it is having the same effect on many
others. Suddenly the hockey stick, the poster-child of the global warming community,
turns out to be an artifact of poor mathematics. How could it happen? What is
going on? Let me digress into a short technical discussion of how this
incredible error took place.
In PCA and
similar techniques, each of the (in this case, typically 70) different data
sets have their averages subtracted (so they have a mean of zero), and then are
multiplied by a number to make their average variation around that mean to be
equal to one; in technical jargon, we say that each data set is normalized to
zero mean and unit variance. In standard PCA, each data set is normalized over
its complete data period; for key climate data sets that Mann used to create
his hockey stick graph, this was the interval 1400-1980. But the computer
program Mann used did not do that. Instead, it forced each data set to have
zero mean for the time period 1902-1980, and to match the historical records
for this interval. This is the time when the historical temperature is well
known, so this procedure does guarantee the most accurate temperature scale.
But it completely screws up PCA. PCA is mostly concerned with the data sets
that have high variance, and the Mann normalization procedure tends to give
very high variance to any data set with a hockey stick shape. (Such data sets have
zero mean only over the 1902-1980 period, not over the longer 1400-1980
period.)
The net result:
the "principal component" will have a hockey stick shape even if most
of the data do not.
McIntyre and
McKitrick sent their detailed analysis to Nature magazine for publication, and it was
extensively refereed. But their paper was finally rejected. In frustration,
McIntyre and McKitrick put the entire record of their submission and the
referee reports on a Web
page for all to see. If
you look, you'll see that McIntyre and McKitrick have found numerous other
problems with the Mann analysis. I emphasize the bug in their PCA program
simply because it is so blatant and so easy to understand. Apparently, Mann and
his colleagues never tested their program with the standard Monte Carlo
approach, or they would have discovered the error themselves. Other and
different criticisms of the hockey stick are emerging (see, for example, the
paper by Hans von Storch and colleagues in the September 30 issue of Science).
Some people may
complain that McIntyre and McKitrick did not publish their results in a
refereed journal. That is true--but not for lack of trying. Moreover, the paper
was refereed--and even better, the referee reports are there for us to read.
McIntyre and McKitrick's only failure was in not convincing Nature that the paper was important enough to
publish.
How does this
bombshell affect what we think about global warming?
It certainly
does not negate the threat of a long-term global temperature increase. In fact,
McIntyre and McKitrick are careful to point out that it is hard to draw
conclusions from these data, even with their corrections. Did medieval global
warming take place? Last month the consensus was that it did not; now the
correct answer is that nobody really knows. Uncovering errors in the Mann
analysis doesn't settle the debate; it just reopens it. We now know less about
the history of climate, and its natural fluctuations over century-scale time
frames, than we thought we knew.
If you are concerned
about global warming (as I am) and think that human-created carbon dioxide may
contribute (as I do), then you still should agree that we are much better off
having broken the hockey stick. Misinformation can do real harm, because it
distorts predictions. Suppose, for example, that future measurements in the
years 2005-2015 show a clear and distinct global cooling trend. (It could happen.) If we
mistakenly took the hockey stick seriously--that is, if we believed that
natural fluctuations in climate are small--then we might conclude (mistakenly)
that the cooling could not be just a random fluctuation on top of a long-term
warming trend, since according to the hockey stick, such fluctuations are
negligible. And that might lead in turn to the mistaken conclusion that global
warming predictions are a lot of hooey. If, on the other hand, we reject the
hockey stick, and recognize that natural fluctuations can be large, then we
will not be misled by a few years of random cooling.
A phony hockey
stick is more dangerous than a broken one--if we know it is broken. It is our
responsibility as scientists to look at the data in an unbiased way, and draw
whatever conclusions follow. When we discover a mistake, we admit it, learn
from it, and perhaps discover once again the value of caution.
Richard A.
Muller, a 1982 MacArthur Fellow, is a physics professor at the University of
California, Berkeley, where he teaches a course called "Physics for Future
Presidents." Since 1972, he has been a Jason consultant on U.S. national
security.