Spectral analysis of climate data shows a strong narrow peak with period ~ 100 kyr, attributed by the Milankovitch theory to changes in the eccentricity of the earth's orbit. The narrowness of the peak does suggest an astronomical origin; however the shape of the peak is incompatible with both linear and nonlinear models that attribute the cycle to eccentricity or (equivalently) to the envelope of the precession. In contrast, the orbital inclination parameter gives a good match to both the spectrum and bispectrum of the climate data. Extraterrestrial accretion is proposed as a mechanism that could link inclination to climate, and experimental tests are described that could prove or disprove this hypothesis.
links to figures:
Fig 1. oxygen isotope data show a narrow 100 kyr spectral peak
Fig 2. spectra of data and theoretical models Orbital inclination matches, not eccentricity.
Fig 3. orbital inclination transformed from ecliptic coordinates to invariable plane
Fig 4. time domain analysis gives good match between data and orbital inclination
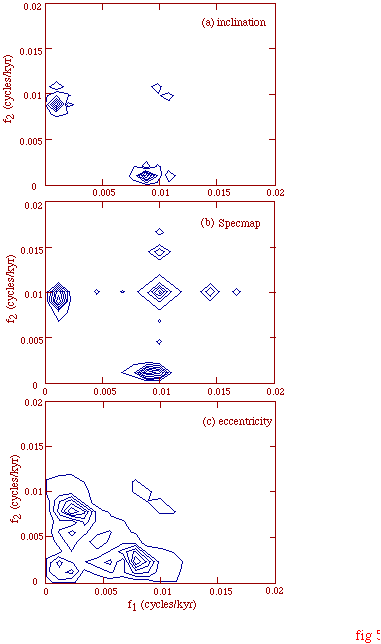
Fig 5. bispectra of data matches orbital inclination, not eccentricity
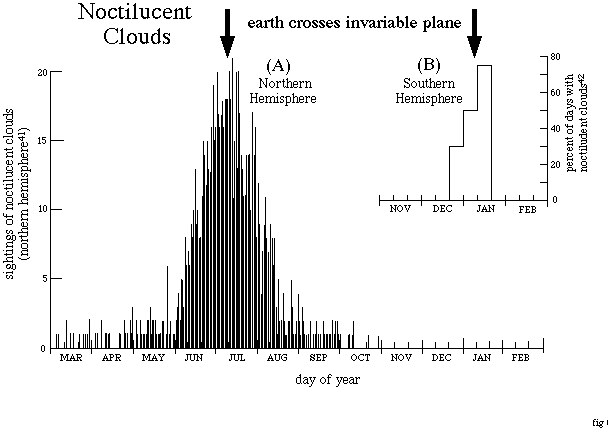
Fig 6. noctilucent clouds reach maximum when earth pass through invariable plane
Introduction
For over a century it has been argued that changes in the Earth's orbital eccentricity were responsible for the primary cycle of the ice ages (ref 1-4). Although the eccentricity changes were small (between 0.01 and 0.05), they can be calculated with good accuracy back at least several million years (ref 5, 6) and they show quasi-periodic behavior with a period of about 100 kyr. Milankovitch (ref 2) proposed that the eccentricity affected the climate through its effect on insolation, the average solar energy reaching the earth. The discovery (ref 3) of a strong quasi-periodic 100 kyr cycle in the climate data, in approximate phase coherence with the eccentricity, gave strong support to the theory. But the calculated insolation changes from eccentricity were too small to account for the strong 100 kyr cycle (ref 7). Moreover a second expected eccentricity period near 400 kyr is absent in most climate records, leading to specific disagreements between eccentricity and glacial data at both 400 ka and the present. Dozens of proposed explanations for the discrepancies have been proposed; in a recent review, Imbrie et al. (ref 8) give a "short list" consisting of seven different groups of models. Many involve resonant or nonlinear behavior of the ice-ocean-atmosphere system; some derive the 100 kyr period from the envelope of the variation in the precession parameter.
As dating has become more accurate, another possible problem with the Milankovitch insolation mechanism has developed: several recent experiments suggested that the abrupt terminations of the ice ages preceded the warming from insolation (ref 9, 10), an effect we refer to as the "causality problem." The interpretation of these results has been debated (ref 11, 12, 13). Imbrie et al. (ref 11) argued that a true test of the Milankovitch theory must be performed in the frequency domain, not the time domain. However we will show that the Milankovitch theory also has a previously unrecognized and serious problem in the frequency domain.
In this paper, we present a new full-resolution spectral analysis of delta18O proxy climate records. The analysis exposes spectral features that have a direct bearing on the validity of published models. In particular, the 100 kyr period is shown to yield a narrow single peak, a simple pattern that strongly confirms an astronomical origin, but which cannot be reconciled with any of the models presented in the review by Imbrie et al. (ref 8)
We will also show that a previously ignored astronomical cycle, that of the orbital inclination, passes the spectral tests failed by the eccentricity. In addition the cycles precede the effects, and thus have no causality problem. Although the orbital inclination does not affect the insolation and therefore was ignored by previous analysts, the match to the spectrum and bispectrum is excellent, and so a linking mechanism to climate should be sought. We will speculate on one possibility for that mechanism: the accretion of extraterrestrial dust or meteoroids.
Climate Proxy Records
The isotopic composition of the oxygen isotopes in sediment is believed to reflect the percentage of the Earth's water frozen in ice, and thus changes in the oxygen isotope ratio, delta18O, are measures of the Earth's climate. We used two primary records in this analysis: from Ocean Drilling Project Site 607 (ref 14), and the SPECMAP compilation (ref 15). We chose these records because both had time scales which had not been "tuned" to match a presumed 100 kyr eccentricity cycle. Such tuning, had it been done, could have artificially narrowed the width of the 100 kyr spectral peak. The delta18O signal for these data for the past 600 kyr are shown in Fig. 1A and 1B. The similarity between the two records is evident; the dominant feature is the 100 kyr cycle. The spectra for these data are shown in Fig. 1C and 1D. For Site 607, which has unevenly-spaced data, the spectrum was calculated using the method of Lomb (ref 16, 17, 18); however we obtained essentially identical results using interpolation and data taper followed by a standard Fourier transform, or the Blackman-Tukey method (provided full lags were used).
Figure 1. delta18O for past 800 kyr. (A) shows the data of Site 607 from Ruddiman et al. (ref 14). (B) shows the SPECMAP stack of Imbrie et al. (ref 15); (C) shows the spectral power of Site 607; and (D) the spectral power of SPECMAP. In the Milankovitch theory, the peak near 0.01 (100 kyr period) is attributed to eccentricity, the peak near 0.024 (41 kyr period) to obliquity, and the peak near 0.043 (23 kyr period) to precession. return to beginning
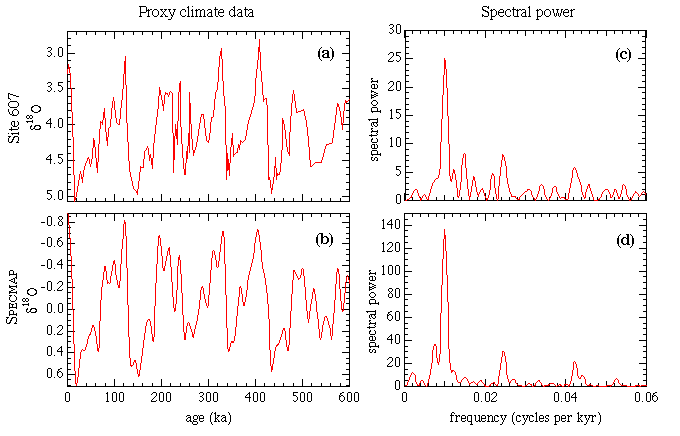
The Milankovitch model attributes the peak near 0.01 cycles per kyr (100 kyr period) to variations in the earth's eccentricity, the 0.024 cpkyr peak (41 kyr period) to changes in the obliquity (tilt of the earth's axis with respect to the ecliptic), and the 0.04 cpkyr peak (23 kyr period) to changes in the precession parameter (the delay between perihelion and summer solstice). Note that the full-width at half maximum of the 0.01 cpkyr (100 kyr) peak is 0.0016 cpkyr, near the theoretical minimum width (0.0015 cpkyr) that can be obtained with a 600 kyr interval. [The theoretical fwhm is given by df = 0.886/dt where 0.886 = 1.3916*2/pi, and 1.3916 is the solution to the problem x = sqrt(2sin(x)).] A reanalysis of the original "Pacemaker" core stack of Hays, Imbrie, and Shackleton (ref 7) with full spectral resolution also produces a single narrow peak, FWHM =.0019, which is the theoretically minimum width for the 464 kyr interval. Likewise a spectral reanalysis of the data19 from Site 806 shows a single narrow peak.
The narrow width of the 100 kyr peak is the most surprising feature found in the analysis. Its width strongly suggests astronomical origin, since all known cycles within the earth-atmosphere system have energy transfer mechanisms that cause of loss of phase stability. (Timekeeping was originally based on astronomy because it was only in this low friction realm that processes were truly periodic.) Thus some sense, the narrowness of this peak is a triumph for those who have argued that the ice ages are astronomically driven. The narrowness of the 41 kyr and 23 kyr cycles is not necessarily significant, since the time scale of the data was "tuned" by adjusting the sedimentation rate to match the expected orbital cycles. However the 100 kyr peak is incoherent with these two other cycles. The fact that an unrelated peak is that sharp can be considered a postiori evidence that the tuning procedure yielded a basically correct time scale. However, note that the tuned time scale could be incorrect by an overall stretch factor and delay without significantly broadening the peak.
Nevertheless, the narrowness of the 100 kyr peak was unanticipated by (and is not easily reconciled with) any published theory. It was missed in previous spectral analysis of isotopic data because of the common use of the Blackman-Tukey algorithm20 which, as usually applied (lag parameter = 1/3), artificially broadens narrow peaks by a factor of 3. The Blackman-Tukey algorithm gained wide use in the 1950s because it performs an averaging procedure before any sines and cosines are calculated; if there is chatter or other uncertainty in the time scale, then the number of transcendental functions that must be calculated can be substantially reduced. However the presence of the narrow 100 kyr peak is a postiori evidence that the tuning in the 0-600 ka range has been successful (at least to within a phase and a linear scale factor), and that no significant chatter is present. As mentioned earlier, if applied with full resolution (lag parameter = 1), then the Blackman-Tukey method also yields a single narrow peak for the 100 kyr cycle in the data.
The region of the 100 kyr peak for the delta<sup>18</sup>O data is replotted in figures 2A and 2B with an expanded frequency scale. These plots can be compared with the spectral power of the eccentricity variations, shown in Fig. 2C, calculated from the orbital results of Quinn et al. (ref 6). Three strong peaks are present in the eccentricity spectrum: near 0.0025 cycles per kyr (400 kyr period), near 0.008 cpkyr (125 kyr period) and near 0.0105 cpkyr (95 kyr period). The disagreement between the spectra of the climate and the spectrum of the eccentricity is evident. The absence of the 400 kyr peak in the climate data has long been recognized (for a review see Imbrie et al., ref 8), and models have been devised to suppress that peak. The cancellation that takes place between the cycles near 400 kyr has been referred to by Imbrie et al. (ref 8) as the "Stage-11 Problem," since no cancellation is seen in the isotopic data. (Following the pioneering work of Emiliani, the isotopic record has been traditionally broken into short regions called stages.) However there is an equally strong disagreement near the present, a conflict that has been called the "Stage-1 Problem."
Figure 2. Spectral fingerprints in the vicinity of the 100 kyr peak: (a) for data from Site 607; (b) for data of the SPECMAP stack; (c) for a model with linear response to eccentricity, calculated from the results of Quinn et al. (ref 6); (d) for the nonlinear ice-sheet model of Imbrie and Imbrie (ref 22); and (e) for a model with linear response to the inclination of the Earth's orbit (measured with respect to the invariable plane). All calculations are for the period 0-600 ka. The 100 kyr peak in the data in (a) and (b) do not fit the fingerprints from the theories (c) and (d), but are a good match to the prediction from inclination in (e). return to beginning
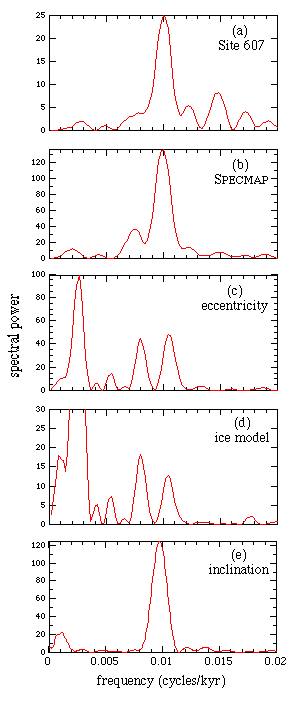
Far more important to our present analysis, however, is the fact that the predicted 100 kyr "eccentricity line" is actually split into 95 and 125 kyr components, in serious conflict with the single narrow line seen in the climate data. The splitting of this peak into a doublet is well known theoretically (see, e.g., ref 5), but in comparisons with data the two peaks in the eccentricity were merged into a single broad peak by the poor resolution of the Blackman-Tukey algorithm (as was done, for example, in ref 8). The single narrow peak in the climate data was likewise broadened, and it appeared to match the broad eccentricity feature.
The disagreement between the data (Figs 2a, 2b) and the theory (Figs 2c, 2d) cannot be accounted for by experimental error or uncertainty. "Tuning" of the time scale to a specific peak (by adjusting the unknown sedimentation rates) can artificially narrow that peak, as well as other peaks that are coherent with it. (See, for example, Neeman, ref 21.) However the data in Figs. 2a and 2b were tuned only to peaks (obliquity and precession) that are incoherent with the 100 kyr eccentricity cycle, so tuning cannot account for the narrow width. Likewise, chatter (errors in the time scale from mis-estimated sedimentation rates) cannot reconcile the disagreement, since although chatter can smear a doublet into a single broad peak, it will not turn a doublet into a single narrow peak.
Next we ask whether a physical mechanism can turn the 95-125 doublet into a single narrow peak. Dissipative mechanisms could obscure the doublet, but (like chatter) they yield a single broad peak or a cluster of doublets. In principle a strong nonlinear process could turn a doublet into a single peak, as it does (for example) in a laser. However, no such mechanism has been identified in the lossy friction-filled environment of the Earth and its atmosphere. Several nonlinear models reviewed by Imbrie et al. (ref 8) derive the 100 kyr feature from the envelope of the precession cycle. However this envelope also has a split peak, since it derives ultimately from eccentricity. As an example, we show the spectrum of the ice sheet model of Imbrie and Imbrie22 in figure 2d. As expected, it too shows the 95-125 doublet, in disagreement with the data. None of the nonlinear models in the recent comprehensive review by Imbrie et al. (ref 8) have the required laser-like mechanism, and they all yield a prediction of a split peak. This is a fundamental disagreement, not easily fixed by adjusting parameters. Unlike the 400 kyr cycle, which is far enough mismatched from the 100 kyr to be suppressed (at least in principle) by the models, the 95-125 doublet peaks are too close.
We can draw the remarkably strong conclusion that variations in the earth's eccentricity cannot be responsible for the 100 kyr glacial cycle.
Orbital inclination: an alternative 100 kyr cycle
In this section we present a possible alternative astronomical cycle as the source of the 100 kyr peak. In Figures 3A, B, and C we plot i, the orbital inclination of the Earth, and Omega, the projection of the inclination vector on the ecliptic (the present plane of the Earth's orbit), taken from Quinn et al. (ref 6). The inclination varies with an approximately 70 kyr cycle. In Figures 3D, E, and F we rotated coordinates to refer i and Omega to the invariable plane (the plane that represents the angular momentum of the solar system, approximately the orbital plane of Jupiter). Note that the inclination measured in this frame has ~ 100 kyr cycle. The power spectrum of the inclination is plotted in figure 2E. The single strong peak near 0.01 cycles/kyr (period 100 kyr), is a remarkably close match to the 100 kyr peak observed in the climate spectra (Figs. 2A and 2B). According to theory, this 100 kyr peak is also split, but only by 10-6 cycles per ky, and this cannot be resolved with the 600 kyr time span. Analysis of longer records depends on having a reliable time scale for the longer periods. For an analysis reaching back 900 kyr see Muller and MacDonald (ref 23).
Figure 3. Variations of the inclination vector of the Earth's orbit. The inclination i is the angle between this vector and the vector of the reference frame; Omega is the azimuthal angle = the angle of the ascending node (in astronomical jargon).. In (A), (B), and (C) the measurements are made with respect to the zodiacal (or ecliptic) frame, i.e. the frame of the current orbit of the Earth. In (D), (E), and (F) the motion has been trasformed to the invariable frame, i.e. the frame of the total angular momentum of the solar system. Note that the primary period of oscillation in the zodiacal frame (A) is 70 kyr, but in the invariable plane (D) it is 100 kyr. return to beginning
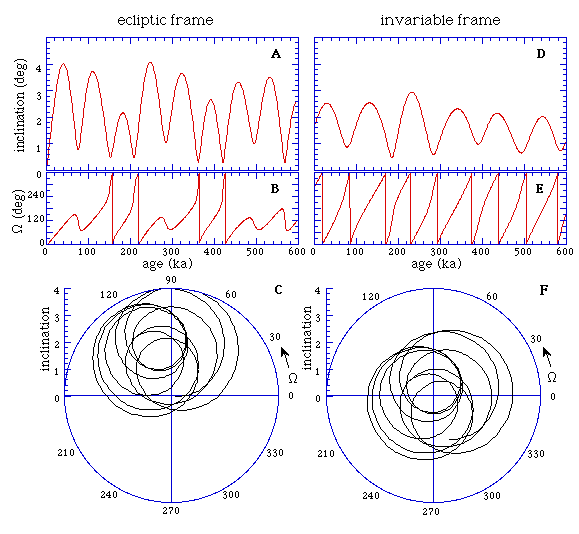
The existence of the 100 kyr cycle of orbital inclination does not seem to have been previously noticed by climatologists. It may have been missed for two reasons. Ever since Milankovitch, the implicit assumption has been that insolation is the driving force for climate cycles, and insolation is not directly affected by orbital inclination. In addition, the 100 kyr cycle is not evident until one transforms to the invariable plane, or to a plane close to it.
The orbital inclination is fit to the delta18O data from SPECMAP in Figure 4. Only three parameters were adjusted in making the fit: two to set the relative scales for inclination and delta18O (i.e. the left and right vertical axes), and a lag representing the delayed response of the ice to the inclination. The best fit was obtained with a lag of 33 +/-3 kyr. This is a plausible result; for example, if low inclination causes cooling, it might affect the rate of ice buildup, and glaciation would lag 1/4 cycle ~ 25 kyr. Additional delay of 10 to 20 kyr could result from mechanisms discussed by Weertman24. (It is also possible that the time scale for Specmap has a systematic bias of 10-20 kyr, since it assumed the climate coupling of obliquity was through insolation; we discuss a possible coupling through accretion below.) The fact that the inclination proceeds the climate response means that there is no "causality problem." The inclination accounts for 43% of the variance in the delta18O signal. (For a record extending back 900 kyr, the fit is even better23, accounting for 48% of the variance.) Considering that there were only three parameters, the agreement is remarkable, and suggests that inclination variations should be seriously considered as a driving force for the 100 kyr glacial cycle.
Fig 4. Comparison between orbital inclination and proxy climate data delta18O from SPECMAP (ref 15). Three parameters were adjusted to put them on the same plot: two scaling parameters that relate delta18O to i, and one lag parameter. The best fit (shown) was at a lag of 33 kyr. In this fit, 43% of the variance of delta18O is accounted for by the inclination. return to beginning
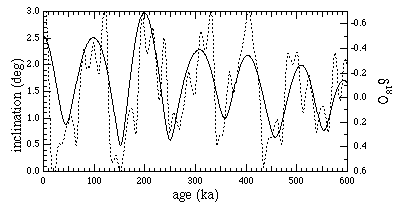
Note that the inclination cycle has no 400 kyr component: the 100 kyr cycle remains strong for the last 600 kyr. Thus the attribution of the cycle to orbital inclination provides a natural (no parameter) solution to the Stage-1 and Stage-11 problems as well as to the causality problem.
Bispectra
Bispectral methods can be used to give an independent test of a causal link between a theoretical driving mechanism and a response. A peak appears in the bispectra only if three frequencies are present in the data, and the third is not only the sum of the other two, but in phase lock with the sum of their phases. The bispectra can strongly suppress noise, and it can yield a completely independent test of a proposed forcing mechanism. For a detailed discussion, see reference 25.
In Figure 5 we show the bispectra of orbital inclination, delta18O (from SPECMAP), and eccentricity. (For a detailed discussion of the calculations and their interpretation, see ref 25.) The strongest peak in inclination (Fig. 5A) is at (f1 = 0.009, f2 = 0.001), indicating that for the orbital variation, the signals near 0.001, 0.01, and 0.009 are frequency and phase locked. This same peak appears as the most significant signal in the delta18O bispectrum, Fig. 5B, confirming the hypothesis that the glacial cycles are driven by orbital inclination. In contrast, the bispectrum of the eccentricity, Fig. 5C, shows little resemblance to the delta18O bispectrum. Thus the bispectra also support the hypothesis that the climate cycles are related to orbital inclination.
Fig 5. Bispectra of (a) inclination of the earth's orbit, (b) delta18O data from SPECMAP, and (c) the eccentricity of the earth's orbit. The inclination and eccentricity were taken from Quinn et al.6 trasformed to the invariable plane. Note the close match between the most significant peaks in the inclination bispectrum and delta18O bispectrum. The scale is linear, and the units arbitrary; for details of the bispectral method see MacDonald and Muller (ref 25). return to beginning
Linking Mechanisms
Since orbital inclination does not affect insolation, we must search for another mechanism relating it to climate. The only plausible one we have found is accretion of interplanetary material: meteoroids and dust. As the orbit of the earth changes, it passes through different parts of the sun's zodiacal ring, and encounters different regions of material. Changes in inclination will be reflected in changes of accretion. Glacier growth occurs during periods of low inclination, and recession during times of high inclination. We emphasize that this mechanism is speculative, and there is no known meteoroid or dust band that satisfies all the properties that we require, although it is possible that such a band could have been missed. We will offer some indirect evidence that accretion does vary with the orbital inclination.
Interplanetary dust accreting on the sun has previously been proposed as a driver of the ice ages (ref 26, 27). Clube (ref 28) discussed the possibility of accretion from a single large and unknown meteoroid stream affecting the Earth's climate, but he did not draw any connection to the periodicity of glacial cycles. Hoyle and Wickramasinghe (ref 29) calculated the effect that accreting dust in the atmosphere could have on the greenhouse effect through the seeding of ice crystals, and they speculated that such accretion could have been responsible for the Little Ice Age. At a meeting of the Royal Astronomical Society reported by G. Manley (ref30), Hoyle discussed the possibility that accretion could remove enough stratospheric water to reduce the greenhouse effect and causing cooling. Stratospheric dust can also be an effective scavenger of other greenhouse gases, such as ozone.
The climate effects of high altitude dust and aerosols are known primarily from volcanic eruptions; global cooling of 0.5 to 1 C was estimated from the eruption of Krakatoa, and measurable climate changes have been attributed to El Chichon and other recent eruptions that injected several megatons of material into the stratosphere (ref 31, 32). Large, explosive volcanic events occur typically once per century, so the average injection of volcanic material is approximately 100 kton/yr. Measurements by Kyte and Wasson (ref 33) of iridium in oceanic sediments show that long-term global average flux from extraterrestrial materials for the period 35-70 Ma is 60-120 kiloton/yr, about the same as the long-term average from present-day volcanic eruptions.
Accretion could cause cooling (as volcanic eruptions suggest) or warming (if cometary particles inject water). Small particles (0.5 micron-diam.) take several years to reach the ground (ref34); larger particles (10 micron) take a few months; gases can reside for much longer. Of course extraterrestrial accretion occurs at the top of the atmosphere, so the climate effects could be significantly different from those of volcanic eruptions. In addition, the global distribution of dust from the two mechanisms is different; for example, stratospheric circulation patterns rarely carry volcanic material to the poles.
If the accretion mechanism is responsible for the coupling of inclination to climate, then the sudden onset of the 100 kyr cycle that took place 900 kyr ago could have been caused by the sudden injection of dust into the solar system, perhaps through the destruction of a large comet. In a recent analysis of He-3 in sediment, K. Farley (ref35) has shown that just such a sudden increase in accretion did take place about 1.2 to 1.5 Myr ago, and this increase could be related to the onset.
Experimental tests
It may be possible to test the accretion hypothesis by searching for the 100 kyr cycle in sedimentary iridium measurements. To search for such an effect, we performed a spectral analysis of 299 iridium data measurements in the late Cretaceous samples of Alvarez et al. (ref 36). We found no peaks above expected noise fluctuations. However, the test was not sufficiently sensitive to test our model since only 25% of the 8.8 ppt iridium in the sample was estimated to be cosmic in origin, and this was too low to see a 100 yr cycle. A definitive test requires sediment with low iridium background, low bioturbation, and frequent sampling. The data of Kyte and Wasson (ref33) cannot be used, since the shortest period detectable is about 600 yr (the average Nyquist period). The best candidate for study may not be sea floor cores, but Greenland and Antarctic ice.
Another test has been suggested by W. Alvarez and K. Farley, and independently by F. Marcantonio at Columbia: a search for the 100 kyr cycles in He-3. The primary source of this isotope in sediment is accretion of extraterrestrial dust. If such dust is responsible for the 100 kyr glacial cycle, then such a period should be seen; however if meteors are the source, then there may be no 100 kyr cycle in the He-3. Such tests are currently underway.
Since the Earth has been experiencing a warm period for the past 10 kyr, the accretion model requires that the present extraterrestrial flux should be small compared to the long term average. In a recent review, Rocchia et al.( ref37) found six of seven published determinations of recent influx measured approximately 10 kiloton/yr; the long-term flux was 6 to 12 times larger, just as our model predicts. They speculate that the recent low flux is a fluctuation, due to the absence of recent large impacts. We tentatively attribute it to a low present value of accretion. If, in fact, the present level of iridium is shown to be equal to the long term average (over the last 100 kyr) then our accretion model is disproven.
Iridium in ice during the period 19-14 ka has also been studied by LaViolette (ref38), who found that total cosmic influx during that period was "one to two orders of magnitude higher" than present levels; however his measurements of absolute iridium levels disagree with those made by others37 and until this discrepancy is resolved we cannot consider this to be confirmation of the proposed link between accretion and climate.
There is evidence from the Infrared Astronomical Satellite (ref 39) of a narrow dust band extending only two degrees from the invariable plane. The precise location of these bands is uncertain; they may be orbiting in resonant lock with the Earth (ref 40, 41). It is not clear that these bands contain sufficient material to cause the observed climate effects. We note, however, that even small levels of accretion can scavenge greenhouse gases from the stratosphere, and cool the Earth's climate through the mechanism proposed by Hoyle (ref 30). The dust could also affect climate by seeding the formation of much larger ice crystals. The accreting material could be meteoric, originating as particles too large to give detectable infrared radiation.
Data on noctilucent clouds (mesospheric clouds strongly associated with the effects of high meteors and high altitude dust) supports the hypothesis that accretion increase significantly when the Earth passes through the invariable plane. As shown in Figure 6, a strong peak in the number of observed noctilucent clouds occurs on about July 9 in the northern hemisphere (ref 41, 42) within about a day of the date when the Earth passes through the invariable plane (indicated with an arrow). In the southern hemisphere the peak is approximately on January 9, also consistent with the invariable plane passage, but the data are sparse. The coincidence of the peaks of the clouds with the passage through the invariable plane had not previously been noticed, and it supports the contention that there is a peak in accretion at these times. On about the same date there is a similarly narrow peak is observed in the number of polar mesospheric clouds (ref43) and there is a broad peak in total meteoric flux (ref 44). It is therefore possible that it is the trail of meteors in the upper atmosphere, rather than dust, that is responsible for the climate effects.
Fig 6. Frequency of noctilucent clouds vs. day of year, in (A) the northern hemisphere, and in (B) the sourthern hemisphere (ref 41, 42). The arrows indicate the dates when the earth passes through the invariable plane. The coincidence of these dates with the maxima in the noctilucent clouds suggests the presence of a thin ring around the sun. Peaks on the same dates are seen in Polar mesospheric clouds (ref 44) and in radar counts of meteors. return to beginning
Other Spectral Features: 41 kyr, 23 kyr, and 70 kyr
The second strongest line seen in the climate data is the 41 kyr period, attributed by Milankovitch to changes in insolation associated with obliquity variations. He postulated that insolation at high latitudes plays an important role in climate, and this variation is strongly dependent on obliquity. However it is also plausible that accretion at the poles can affect polar ice, and such accretion could also depend on the obliquity parameter. (There is little atmospheric mixing that would bring low latitude material to the poles.) Thus, although it is possible that the 41 kyr period is due to insolation, it could be driven by accretion. If so, then the phase of the obliquity signal might be reversed from that of the standard Milankovitch insolation model, since cool weather would be expected to occur during periods of high obliquity rather than low, and this could affect the orbitally-tuned time scale by as much as 20 kyr (a half cycle). Similar mechanisms could link the precession cycles (periods of 23 and 19 kyr) to accretion. Measurements of iridium and He-3 densities in ice cores and sediment could help distinguish whether these cycles are due to the insolation mechanism of Milankovitch or to extraterrestrial accretion.
In his analysis of delta18O data from core V19-30 from the Eastern Pacific, MacDonald (ref 45) reported only one "anomalous peak" at 0.014 +/- 0.001 cpkyr (70 kyr period) that was not accounted for by known orbital frequencies. Ruddiman et al.(ref 14) also observed this peak (see Fig. 1C); they too considered it "anomalous" since it was not part of the insolation theory, and they adjusted their time scale to try to suppress it. The peak also appears in the "Pacemaker" seafloor stack of ref 7 -- when analyzed with full resolution -- with higher spectral power and statistical significance than either the 23 or 19 kyr lines that were considered important at the time of its publication in 1976. We note that the frequency of this peak is identical to that of Omega, the precession of the inclination vector plotted in Figure 3E. A spectral analysis of Omega shows it to be dominated by a single line at 70 kyr, indistinguishable from the line seen in the data. Dust and meteoroids produced in a catastrophic collision could have an azimuthal variation and thus show up modulated with the period of Omega. Thus accretion could also be the source of the 70 kyr peak.
Summary
The narrow width of the 100 kyr glacial cycles strongly supports an astronomical origin. It also argues that the orbitally-tuned paleontological time scales (those obtained by fitting the data to obliquity and precession cycles) are basically correct, at least to within a time delay and overall rate. However we know of no model, linear or nonlinear, that can reconcile the of eccentricity with the observed narrow 100 kyr glacial cycle. This is a severe and possibly fatal problem for the conventional Milankovitch mechanism of insolation, although insolation variations might account for the weaker 41 and 23-19 kyr cycles. Time scales which were tuned to a 100 kyr cycle derived from eccentricity (e.g. which use nonlinear ice models as a target) may have serious systematic errors.
We are not arguing that eccentricity cannot have an effect on glaciation. Perhaps we should be reassured that the insolation calculations, which always predicted a very small eccentricity effect, have been verified. If eccentricity does affect climate, the best way to look for it would be at the strongest expected frequency: that of the 400 kyr cycle.
In contrast, the inclination of the Earth's orbit matches both the spectral and the bispectral fingerprints of the climate data, and accounts for the absence of the 400 kyr cycle (the stage-1 and stage-11 problems). It also gives a natural solution to the controversial causality problem. The precession of the inclination vector also gives a natural source for the 70 kyr "anomalous" line of MacDonald (ref 43).
The only plausible mechanism that we have found that could link orbital inclination to climate is extraterrestrial accretion of dust or meteoroids. Although there is circumstantial evidence supporting this picture (e.g., the maximum in noctilucent clouds when the earth passes through the invariable plane, and the low present iridium levels), the weakest part of the proposed mechanism is the absence of a clearly identifiable band of meteoroids or dust responsible for it. Meteor streams are virtually impossible to find unless the earth passes through them. Dust bands may have been missed in past surveys, which require three-dimensional modeling in order to separate physical structures from the data. It is also possible that a totally different mechanism (other than accretion) links climate to inclination. A definitive test of the accretion model can be made by studying iridium and He-3 variations in sediment and ice.
References and Notes
1. J. Croll, Phil. Mag. 33, 119-131 (1867).
2. M. Milankovitch, Théorie Mathématique des Phénomenes Thermiques Produits par la Radiation Solaire, Gauthier-Villars, Paris (1920); Canon of Insolation and the Ice-Age Problem, Royal Serbian Acad. Sp. Pub. 132 (1941), Israel Program Sci. Trans., Jerusalem (1969).
3. W. S. Broecker and J. van Donk, Reviews of Geophysics and Space Physics 8, pp 169-197 (1970).
4. J. Imbrie and K. Imbrie, Ice Ages, Solving the Mystery, Enslow Publishers (1979).
5. A. Berger, and M. Loutre, Quat. Sci. Rev. 10, 297-317 (1991).
6. T. R. Quinn, S. Tremaine, M. Duncan, Astron. Jour. 101, 2287-2305 (1991).
7. J.Hays, J. Imbrie, and N. Shackleton, Science, 194, 1121-1132 (1976).
8. J. Imbrie, A. Berger, E. Bogle, S. Clemons, A. Duffy, W. Howard , G. Kukla, J. Kutzbach, D. Martinson, A. McIntyre, A. Mir, B. Molfino, J. Morley, L. Petterson, N. Psias, W. Prell, M. Raymo, N. Shackleton, and J. Toggweller, Paleoceanography 8, 699-735 (1993).
9. I. J. Winograd et al, Science 258, 255-260 (1992).
10. B. J. Szabo, K. R. Ludwig, D. R. Muhs, K. R. Simmons, Science 266, 1994; M. McCulloch, "U-Th Dating of Last Interglacial Corals." (to be published)
11. J. Imbrie, A. C. Mix, D. G. Martinson, Nature 363, 531-533 (1993).
12. I. J. Winograd and J. Landwehr, USGS Open-File report 93-357, Reston VA (1993).
13. W. S. Broecker, Nature 359, 779-780 (1992); N. Shackleton, Nature 362, 596 (1993); K. Ludwig et al., Nature 362, 596 (1993); C. Emiliani, Nature 364, 583 (1993); J. Landwehr, I. J. Winograd, T. B. Coplen, Science 368, 594 (1994).
14. W. Ruddiman, M. Raymo, D. Martinson, B. Clement, and J. Blackman, Paleoceanography 4, 353-412 (1989).
15. J. J. Imbrie, J. Hays, D. Martinson, A. McIntyre, A. Mix, J. Morley, N. Pisias, W. Prell, and N. Shackleton, in Milankovitch and Climate, Part 1, (eds. A. L. Berger et al.), pp. 269-305. D. Reidel (1984).
16. N. Lomb, Astrophys. Space Sci., 39, 447-462 (1976).
17. G. MacDonald, Rev. Geophys., 27, 449-469 (1989).
18. W. Press and G. Rybicki, Astrophys. J. 338, 277-280 (1989); W. H. Press, B. Flannery, S. Teukolsky, W. Vetterling, Numerical Recipes, Cambridge University Press (1993)
19. W. H. Berger et al., Geology 22, 463-467 (1994).
20. R. B. Blackman and J. W. Tukey, The Measurement of Power Spectra, Dover, New York (1958)
21. B. U. Neeman, "Orbital Tuning of Paleoclimatic Records: a Reassessment," submitted to Journal of Climate (revised July 1994).
22. J. Imbrie and J. Z. Imbrie, Science 207, 943-953 (1980).
23. R. A. Muller and G. J. MacDonald, Lawrence Berkeley Laboratory Report LBL-35667 (1994).
24. J. Weertman, J. Glaciol., 5, 145-158 (1964).
25. G. MacDonald and R. Muller, Lawrence Berkeley Laboratory Report LBL-36214 (1994).
26. F. Hoyle and R. A. Lyttleton, Proc. Camb. Phil. Soc. 35, 405-415 (1939).
27. W. H. McCrea, Nature 255, 607-609 (1975).
28. S. Clube,Phil. Trans. R. Soc. Lond. A 323, 421-436 (1987).
29. F. Hoyle and N.C. Wickramasinghe, Nature 350, 467 (1991).
30. G. Manley, Nature 173, pp 1206-1208 (1953).
31. H. Sigurdsson, Geol Soc. Am. Spec. Paper 247, 99-108 (1990).
32. K. Ya. Kondratyev, Climate Shocks: Natural and Anthropogenic (Wiley, New York, 1988).
33. F. T. Kyte and J. T. Wasson, Science 232, 1225-1229 (1986).
34. O. B. Toon, J. B. Pollack, T.P. Ackerman, R. P. Turco, C.P. McKay, M. S. Liu, Geol. Soc. Am. Spec. Paper 190, 187-200 (1982).
35. K. Farley, "A 70 Million Year Record of Extraterrestrial Helium Fallout to the Deep Sea," submitted to Nature (March, 1995).
36. W. Alvarez, F. Asaro, A. Montanari, Science 250, 1700 (1990).
37. R. Rocchia, P. Bonté, C. Jéhanno, E. Robin, M. de Angelis, D. Boclet, in Global catastrophes in earth history, V. Sharpton and P. Ward eds, Geol. Soc. Am. Spec. Paper 247, pp 189-193 (1990).
38. P. A. LaViolette, P.A., Meteoritics 20, 545-558 (1985).
39. G. Neugebauer et al., Science 224, 14-21 (1984)
40. A. A. Jackson and H. A. Zook, Nature 337, pp 629-637 (1989).
41. S. Dermott, S. Jayaraman, Y. Xu, B. Gustafson, J. Liou, Nature 369, 719-723 (1994).
41. B. Foyle and B. Haurwitz, Noctilucent Clouds, Space Science Rev. 6, 279-340 (1966).
42. G. E. Thomas, Rev. Geophysics 29, 553-575 (1991).
43. G. E. Thomas and J.J. Olivero, J. Geophys. Res. 94, 14673-14681 (1989).
44. F. L. Whipple and G. S. Hawkins, J. of Met. 13, 236 (1956).
45. G. MacDonald, in Global Climate and Ecosystem Change, edited by G. MacDonald and L. Sertorio, 1-95, Plenum Press, New York (1990).
We thank W. Alvarez and W. Press for helpful suggestions, and M. Raymo and S. Tremaine for sending us their results in digital form.