 |
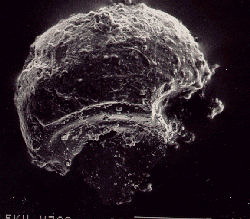
| Figure 1. SEM picture of lu25. |
Optical Observations: This spherule was a transparent, yellow-green color. There appeared to be many small bumps on the the surface. A large chip was removed from one side of the spherule, possibly due to a secondary impact or when the spherule landed. The side opposite the chip appeared to be very smooth. The spherules dimensions are approximately 245 x 175 um.
SEM (Scanning Electron Microscope) Observations: The spherule has obviously been heavily damaged. The chip seen in the optical observations may be on the lower left of figure 1.The surface of the spherule is covered with many small bumps of unknown origin.
 |
| Figure 1. SEM picture of lu25. |
Electron Microprobe Observations: The electron microprobe is able to determine the elemental compositions of the lunar spherules. These are typically presented in the form of oxide weight percentage of the various elements that we analyzed for (table 1).
| SiO2 | Fe2O3 | CaO | Al2O3 | MgO | TiO2 | Na2O | K2O | Sum | |
|---|---|---|---|---|---|---|---|---|---|
| Avg. Wht %: | 42.4 | 11.4 | 13.4 | 17.5 | 7.4 | 4.9 | 0.5 | 0.09 | 97.6 |
| Highest Con: | 95.5 | 56.9 | 19.5 | 36.8 | 18.5 | 17.4 | 3.5 | 0.54 | 106.4 |
| Lowest Con: | 20.0 | 0.4 | 0.2 | 0.7 | 0.0 | 0.1 | 0.1 | 0.00 | 95.0 |
| Stndrd Dev: | 5.8 | 5.6 | 2.4 | 7.7 | 3.3 | 3.0 | 0.5 | 0.08 | 1.4 |
| % Stndrd Dev: | 13.6 | 48.6 | 17.7 | 44.1 | 44.8 | 60.0 | 109.5 | 82.49 | 1.5 |
| Table 1. Average weight percent, high and low concentrations, standard deviation and percent deviation of elements in lunar spherule 25. | |||||||||
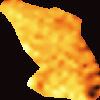
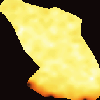
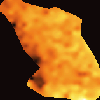
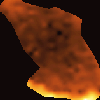
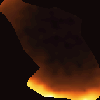
We also have produced elemental "maps" of the spherule (figure 2). In these maps the color intensity represents the concentration of a given element (so, light colors represent high concentrations and dark colors represent low concentrations. Unfortunately, we have not been able to produce good scales for these pictures, although we are working on it. To get a sense of the scale of each picture, look at the average and high and low concentrations given in table 1, above.
 |
 |
 |
 |
| SiO2 | Fe2O3 | CaO | Al2O3 |
 |
 |
 |
 |
| MgO | TiO2 | Na2O | K2O |
| Figure 2. Elemental "maps" of spherule #25. | |||
|---|---|---|---|
The shape of these maps probably show that we are looking at the spherule edge on, similar to the SEM picture.
One reason for chosing this spherule is that the composition of the spherule is homogenus. When you plot the concentration of silicon dioxide versus the other elements we analyzed you can get a sense of this (figure 3).
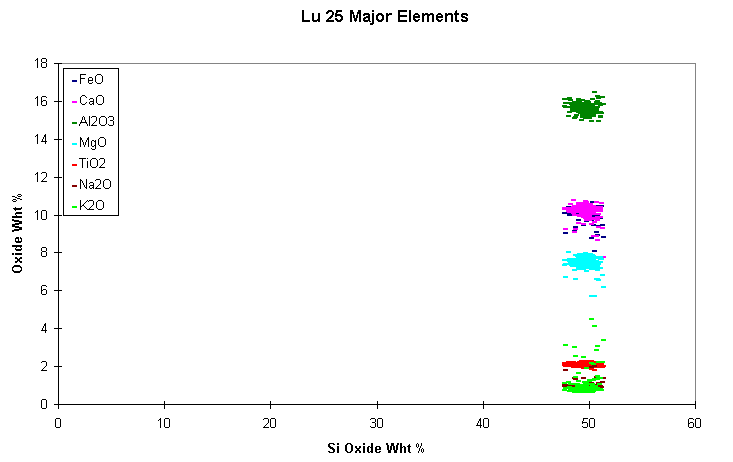 |
| Figure 3. Silicon dioxide weight percent versus other elements (in weight percent). |