Simultaneous presence of
orbital Inclination and eccentricity
in proxy climate records
from Ocean Drilling Program Site 806
Richard A. Muller
Dept. of Physics, University of California
Berkeley California 94720
Gordon J. MacDonald
International Institute for Applied Systems Analysis
A-2361 Laxenburg - Austria
ABSTRACT
Ocean Drilling Program Site 806 in the western Pacific shows evidence of a remarkably constant average sedimentation rate. This feature allows us to analyze ancient climate proxies without the need for "orbital tuning," a standard procedure in prior work, but one that can lead to biased results. Spectral analysis of stable oxygen isotope ratios at this site, a proxy for global ice volume, shows a single narrow peak with a period approximately 100 k.y., a result that supports our model which links glacial cycles to variations in the inclination of the Earth's orbit. In contrast, spectral analysis of the coarse component fraction of the sediment (primarily foraminifera) shows a structure characteristic of standard Milankovitch theory, with a triplet of peaks with periods near those expected from the Earth's eccentricity: 95, 125, and 400 k.y. Bispectral analysis confirms these linkages, but suggests that orbital inclination also plays some role in the coarse fraction. From the clear presence of both signals in different proxies at the same site, we conclude that although eccentricity affected the local climate, it is orbital inclination that drove the variations in the global ice volume for the past million years.
INTRODUCTION
Oxygen isotope records in sea floor sediment show that the Earth's glacial cycles for the past million years were dominated by a 100 k.y. period. Although the Milankovitch theory attributes this cycle to changes in the Earth's orbital eccentricity (for a detailed review, see Imbrie et al., 1993), an alternative has been suggested by Muller and MacDonald (1995), who attribute the cycle to changes in the inclination of the Earth's orbit with respect to the plane of the solar system. Although orbital inclination does not affect insolation (total sunlight hitting the Earth -- the linking mechanism of the Milankovitch theory), it could affect the climate through its effect on extraterrestrial accretion of meteoroids and dust. Spectral and bispectral analyses (Muller and MacDonald, 1996) confirm that the variations in oxygen isotopes, the primary proxy for global ice volume, match the single narrow peak near 100 k.y. expected from inclination variations and are in serious conflict with the triplet peak (near periods of 95, 125, and 400 k.y.) expected from eccentricity.
Nevertheless, there are strong indications in other records that the Earth's eccentricity does have an effect on climate. A study of Triassic lake beds in New Jersey, formed during a time when large glaciers were absent, shows a climate dominated by eccentricity for a period of several million years (Olsen and Kent, 1996). All three peaks of the eccentricity triplet are clearly present in their "depth rank" data, a proxy for lake depth. This result presents us with a puzzle. Why does the eccentricity triplet appear to dominate some climate records, but not the recent cycles of glaciation?
Although the spectra of eccentricity and inclination are quite different, they are remarkably easy to confuse for two reasons: First, it has become traditional to ignore the absence of the expected 400 k.y. eccentricity cycle since it is difficult to see in the short records and plausible effects have been postulated that could suppress it. Second, if there are variations in sedimentation rate ("chatter"), then the 95-125 k.y. doublet from eccentricity can be blurred into a single broad peak, indistinguishable from the 100 k.y. single narrow peak of inclination; similarly, chatter can break a narrow peak into an apparent doublet. Spectral analysis is less sensitive to chatter if done with low resolution, (e.g., by applying the Blackman-Tukey method with lags of 1/3); the danger is that this procedure blurs the eccentricity doublet into a single wide peak even if chatter is absent.
Attempts to compensate for the chatter have been made by using orbital tuning, a process that adjusts modeled sedimentation rate to make the geologic data match an orbital model. However, the very process of such tuning can force the record to match the target spectrum (Muller and MacDonald, 1996; a similar result has been obtained independently by B. Neeman, unpublished), leading to a possibly mistaken linkage between the climate and the orbital parameter present in the tuning target.
In this paper we present results from a location that does not require tuning: Ocean Drilling Program (ODP) Site 806. In their initial work on this site, Berger et al. (1993) concluded that the sedimentation rate was remarkably constant; in their determination of the time scale, only minor adjustments were required. For example, for the past 900 k.y., their deduced sedimentation rate was constant within 6.5% rms (root-mean-square deviation from average). As we shall show below, the constancy of sedimentation at Site 806 is strongly supported by the appearance of extremely narrow spectral lines in the oxygen isotope data. The absence of strong variations in rate of sedimentation allows us to study the spectra of climate proxies in the core without orbital tuning -- an invaluable feature if we are to identify and understand the orbital parameters that affect climate. We will show that both inclination and eccentricity effects are present in the Site 806 data and that they can be distinguished.
DATA
Site 806B is close to the equator (lat 0o19.1'N, long 159o21.7'E, 2520 m depth), on the Ontong Java Plateau in the western Pacific (Shipboard Scientific Party, 1991). In this paper we report (1) a new analysis of the measurements originally reported by Berger et al. (1993), consisting of oxygen isotope measurements of the fossil planktic foraminifera Globigerinoides sacculifer, and (2) an analysis of measurements of the mass fraction of the coarse component in the sediment (sand-sized fraction -- composed primarily of large, undifferentiated foraminifera) from the same site.
d18O is defined as the fractional change in 18O/16O in parts per thousand; its variations in the ocean are driven primarily by changes in the volume of global ice, which is depleted in 18O. We used two determinations for the depth of the samples. The first was to set the depth to the "driller's depth" at the top of each core segment, assume no gaps between segments, and use linear interpolation in between. We call this the "adjusted depth"; there were no adjustable parameters in its determination. The second method was to adopt the scale developed by Berger et al. (1993), who argued that gaps were present between the core segments, and corrected for them by patching data from an adjacent core. The largest patch was for an assumed 75 cm gap near the depth 16 meters. We refer to this depth scale as the "patched depth." The conclusions that we present in this paper are independent of which of these two depth scales we use.
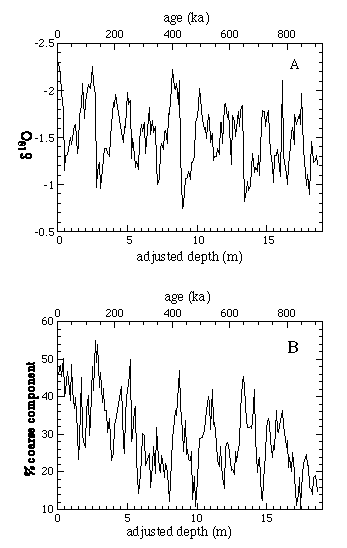
The d18O and coarse component data are shown in Figure 1 as a function of adjusted depth.

Figure 1. Climate proxies vs. adjusted depth: (A) d18O of pelagic foraminifer G. sacculifer; (B) oarse percentage, defined as fractional weight of coarse component ("sand," primarily forams). Data from Berger et al. (1993); adjusted depth was calculated by us and includes no correction for gaps. Time scales at top of each figure are based on (1) assumption that sedimentation rate was constant, as explained in text, and (2) placement of beginning of isotope stage 19 at Brunhes-Matuyama boundary age of 783 ka.
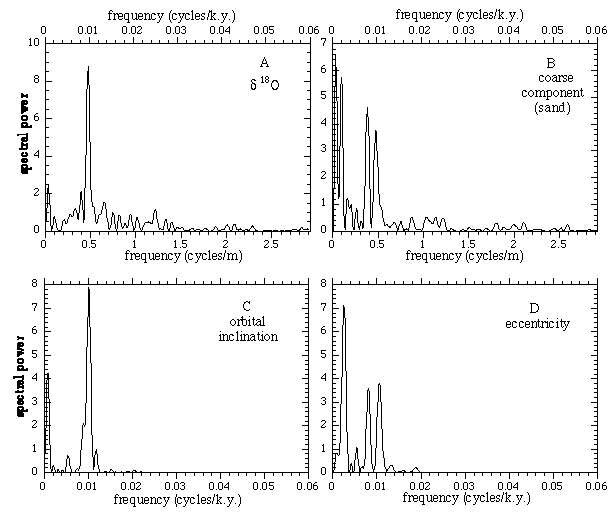
The spectral power for these data are shown in Figure 2. The analysis shown was performed with an unwindowed Fourier transform after interpolation to uniformly spaced points with zero padding to provide intermediate frequencies (MacDonald, 1989); the average spectral power is normalized to unity.

Figure 2. Spectral analysis: (A) d18O of pelagic foraminifer G. sacculifer; (B) coarse component; (C) orbital inclination of Earth, and (D) orbital eccentricity of Earth. Data for (A) and (B) are from Figure 1; data for (C) and (C) were calculated by Quinn et al. (1991) and transformed to invariable plane of solar system by Muller and MacDonald (1995). Note similarity between (A) and (C) and likewise between (B) and (D).
The spectrum of the d18O data is dominated by a strong, narrow peak near 0.47 cycles per meter. It is narrow and not split, with full width at half maximum (FWHM) of 10%, the same as would be obtained for a pure sine wave for the same duration. This means that the signal maintains phase coherence for the entire Å900 k.y. period. Independent of the interpretation of the peak, the narrow width provides strong a postiori confirmation that the sedimentation rate was constant.
TIME SCALE
Time scales have been developed for these data by Berger et al. (1993, 1994, 1995) based on tuning to assumed linkage with standard Milankovitch orbital frequencies. In Berger et al. (1993), the data were filtered to a band near 41 k.y. period, the calculated variations of obliquity (the tilt of the Earth's axis with respect to the Earth's orbital plane). Approximately twenty parameters were then adjusted to achieve a match between the band-limited data and the obliquity target. In Berger et al. (1994, 1995), the target was a more complex insolation model, which included cycles with periods near 125, 95, 41, 23, and 19 k.y.
Tuning, however, can create false spectral lines that match the lines of the target spectrum, as was shown in detail by Neeman (1993). When phase coherence is achieved between the data and the target, the spectrum of the data takes on the same spectrum as the target; in addition, the narrow-band amplitude modulation of the target signal is often reproduced. In a previous analysis (Muller and MacDonald, 1996) we argued for "minimal tuning," i.e., tuning only to frequencies that were not being studied. However, the nearly constant sedimentation rate displayed at Site 806 gives us a unique opportunity to study the climate signal without the biases that might be introduced by tuning. To do this we assumed an absolutely constant sedimentation rate and set the beginning of oxygen isotope stage 19 (the peak seen at the adjusted depth 16.1 m in Figure 1A) to the age of 783 ka for the Brunhes-Matuyama (B-M) boundary (Baksi et al., 1992). This single adjustment results in the time scale that appears at the top of Figure 1, A and B and in the frequency scale used in the top of Figure 2, A and B.
We do not claim that this is a precise time scale, for two reasons. First, although the determination of the age of the Brunhes-Matuyama boundary by Baksi et al. (1992) has small analytic errors (±11 k.y.), they pointed out that there are possibly large systematic uncertainties from errors in the ages of the standards and in the values of the decay constants. Second, it is unlikely that the sedimentation rate was precisely constant, especially when one considers the observed variations in the sand fraction (which has a mean of 0.29 and standard deviation of 0.09). However, although our time scale may contain inaccuracies, it has the advantage of being unbiased because it is untuned, i.e., it does not assume the correctness of any orbital climate model.
INTERPRETATION OF SPECTRA
In Figure 2C we have plotted the spectrum of orbital inclination changes for the same time interval as the data (0 - 908 ka). In Figure 2D we have plotted the spectrum of the eccentricity changes for the same period. From a comparison of these spectra with the d18O spectra in Figure 2A, we see that the spectrum of the d18O data is similar to that of orbital inclination, but is strikingly different from that of eccentricity; in particular, the spectral power in the vicinity of the frequency f = 0.01 cycles/k.y. (100 k.y. period) is narrow and unsplit. This finding confirms our prior conclusion (Muller and MacDonald, 1996), which showed a similarly narrow peak in data from other sites (the Specmap stack and Site 607). Particularly striking in Figure 2A is the absence of the expected 125 k.y. peak (f = 0.008 cycles/k.y.) from eccentricity. This is a serious problem for theories that attribute the glacial cycle to eccentricity. None of the insolation (i.e. Milankovitch) models summarized in the review of Imbrie et al. (1993) can account for the absence of this peak.
In contrast, the spectrum of the sand-sized component Figure 2B is very similar to that of eccentricity. The power near f = 0.01 cycles/k.y. is split into two peaks, and there is substantial power in the vicinity of f = 0.0025 (400 k.y. period).
To test whether the observed split was dependent on the particular analysis that we used, we recalculated the spectral power by using several standard windows: Hanning, Welch, Parzen, Hamming, Bartlett, and Kaiser (see Press et al., 1993). For each window used, the split nature of the 100 k.y. peak was present, although resolution was degraded, and the structure in the vicinity of 400 k.y. was smoothed. We also did a Blackman-Tukey analysis (Blackman and Tukey, 1958), and the split peak was also present, provided that the lag was set to 2/3 or greater. (At shorter lags, the two peaks were merged into one very broad peak. It was just such a merger in prior analyses that allowed the identification of the d18O cycle with eccentricity.)
A small peak occurs in the d18O data near 0.024 cycles/k.y. (41 k.y. period). It has a spectral power equal to approximately four times the local mean (in the range 0.02 to 0.03 cycles/k.y.) which implies a confidence level greater than 90%. This peak is predicted by the standard Milankovitch theory and is associated with variations in the obliquity of the Earth's orbit, i.e., the tilt of the poles toward the Sun. We consider it likely that this peak arises from the standard Milankovitch insolation mechanism. A similar peak occurs in the spectrum of the coarse component.
PATCHING
Berger et al. (1993) concluded that the recovery of core from Site 806 was incomplete and that there were missing segments. In particular, by comparing the data with data from other sites, they concluded that 75 cm of core were missing in the vicinity of the B-M boundary, and they patched in a section from the nearby Site 805. The process is not unbiased, but for the remainder of this paper, we will assume that their patching and adjustment for core expansion were done correctly. Again, we set the time scale by assuming constant sedimentation rate and setting the beginning of isotope stage 19 to 783 ka.
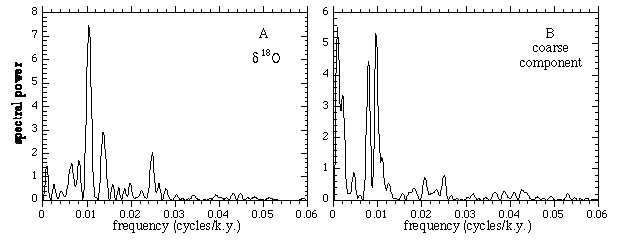
Spectra of the patched data with our constant sedimentation time scale are shown in Figure 3.

Figure 3. Spectra of data from ODP Site 806 after data were patched and adjusted by Berger et al. (1994). We assumed constant sedimentation rate and set the beginning of isostope stage 19 to an assumed Brunhes-Matuyama age of 783 ka. Basic spectral features are similar to those in Figure 2.
The main features of our analysis with the unpatched data are reproduced: the single narrow peak in the d18O spectrum and the split character of the peak in the coarse component. The obliquity peak near 0.024 cycles/k.y. (41 k.y. period) has been substantially strengthened to over 10 times the local power; this is a result of the strong cycle that was patched into the missing 75 cm section. In addition, a new peak has appeared near frequency f = 0.014 cycles/k.y. (69 k.y. period). The occurrence of a peak with about this frequency in other data sets was first noted by MacDonald (1990). If real, it may be the orbital parameter * as we suggested previously (Muller and MacDonald, 1996). It could also be an artifact from nonlinear interference between the 100 k.y. peak and the strengthened 41 k.y. peak (since 1/41 - 1/100 Å 1/69). But our basic conclusion is unchanged: that d18O variation is driven by inclination, while the coarse component mass fraction variation is driven by eccentricity.
BISPECTRA
Bispectral analysis provides a powerful additional method for comparing two records. Peaks in the bispectra indicate the presence of three frequencies: f1, f2, and f3 = f1 + f2, in a coherent phase relationship. Such frequencies in a driving force (e.g. inclination or eccentricity) should show up in the response function (d18O or coarse component). Note that it is possible for other peaks, not present in the driving force, to be present in the climate proxy; these can be created by any nonlinear climate response. Regardless, the strong bispectral peaks in the driving force should be present. For further discussion of the application and interpretation of bispectra for geophysical data, see MacDonald and Muller (1994).
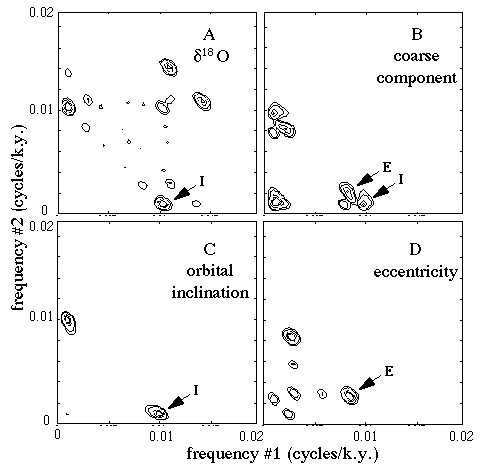
The bispectra for the data are shown in Figure 4, along with the bispectra of the orbital elements. These bispectra were calculated by using the patched time scale of Berger et al. (1993); however, essentially the same results are obtained when we perform the analysis with the adjusted but unpatched data of Figure 1. The only substantial difference was the absence of the peak seen in Figure 4A near (f1, f2) = (0.01, 0.014).

Figure 4. Bispectra: (A) d18O for site 806, (B) coarse component for site 806, (C) orbital inclination, and (D) eccentricity. Each plot is symmetric about its diagonal. The major signature of orbital inclination is the peak marked I at (f1, f2) = (0.01, 0.001); the major signature of eccentricity is the peak marked E at (f1, f2) = (0.08, 0.03). Bispectrum of d18O shows I alone; bispectrum of coarse component shows both E and I. Time scale is same as for Figure 3.
Orbital inclination has one strong bispectral peak near the frequency pair (f1, f2) = (0.01, 0.001); we marked this inclination signature with the symbol I in Figure 4C. Eccentricity has a strong bispectral peak near (f1, f2) = (0.008, 0.002); we marked this eccentricity signature with the symbol E in Figure 4D. Note that the peak I also appears in the bispectra of d18O (Figure 4A), confirming the linkage to orbital inclination; the peak E is absent, and this fact can be taken as additional evidence that eccentricity does not contribute to d18O. In contrast, both I and E appear in the bispectrum of the coarse component (Figure 4B). This fact suggests that both eccentricity and orbital inclination contribute to the behavior of the coarse component signal.
If the Å 70 k.y. peak seen in d18O is a nonlinear interaction of the 100 k.y. cycle and the 41 k.y. cycle, then we might expect to see a peak in the bispectrum near (f1, f2) = (0.01, 0.014). Indeed, just such a peak is seen in the bispectrum of the patched data (Figure 4A), but it is not present in the bispectrum of the adjusted (but unpatched) data. This result lends support to the hypothesis that the 70 k.y. peak is an artifact of the nonlinear process of patching, rather than an indication of the presence of the orbital precession term * of Muller and MacDonald (1996).
DISCUSSION AND CONCLUSIONS
Spectral and bispectral analyses of untuned d18O data from ODP site 806 show that the 100 k.y. glacial cycle is not driven by eccentricity, as the Milankovitch theory proposes, but is related to changes in the inclination of the Earth's orbit. This finding confirms the conclusion based on minimally-tuned data from Specmap and Site 607 (Muller and MacDonald, 1996).
The climate effects of eccentricity changes are seen in the data, but not in the proxies for global ice; rather they are seen in the sand-sized coarse fraction, which is primarily planktic foraminifera. The presence of the eccentricity signature in this signal could be explained if the foraminifera were a proxy for local climate, perhaps linked through surface-water productivity or bottom-water dissolution.
A small 41 k.y. obliquity cycle is present in the d18O data, and it may be linked to the climate through its effect on insolation, as in the classical Milankovitch theory. The 70 k.y. cycle in d18O data could be caused by orbital precession, or it could be a nonlinear artifact of the patching process.
If the 41 k.y. obliquity cycle in the d18O data comes from insolation, then why is there no eccentricity signal? One possible answer is that insolation calculations always showed the eccentricity effect to be small; in fact, the strength of the observed 100 k.y. cycle was considered an unsolved problem (see, for example, Imbrie et al., 1993). In addition, the Milankovitch response to eccentricity depends on an asymmetry in the Earth: the fact that most of the land mass is in the Northern Hemisphere. However, if glaciation is affected primarily by insolation at the poles with no asymmetry -- both poles given equal weighting -- then the dominant insolation response should be to obliquity. In contrast, the presence of an eccentricity response in the coarse component fraction could reflect the sensitivity of the equatorial climate to seasonal changes in the Earth-Sun separation, which do depend on eccentricity.
ACKNOWLEDGMENTS
We thank W. Alvarez, D. Karner, and the Berkeley Renaissance Geology group for many helpful comments, criticisms, and lively discussions. We are grateful to W. H. Berger and M. K. Yasuda for providing the data for ODP Leg 130 and for helping us to understand the process of adjusting and patching. We thank M. Raymo for pointing out an error in our initial treatment of the data.
REFERENCES CITED
Baksi, A., Hsu, V., McWilliams, M., and Farrar, E. ,1992, 40Ar/39Ar dating of the Brunhes/Matuyama geomagnetic field reversal: Science v. 256, p. 356-357.
Berger, W. H., Bickert, T., Schmidt, H., and Wefer, G., 1993, Quaternary oxygen isotope record of pelagic foraminifers: Site 806, Ontong Java Plateau: in Berger, W. H., Kroenke, L. W., Mayer, L. A., et al., Proceedings of the Ocean Drilling Program, Scientific Results, v. 130, p. 381-395.
Berger, W. H., Yasuda, M. K., Bickert, T., Wefer, G., Takayama, T., 1994, Quaternary time scale for the Ontong Java Plateau: Milankovitch template for Ocean Drilling Program 806, Geology, v. 22, p. 463-467.
Berger, W. H., Bickert, T., Wefer, G., and Yasuda, M. K., 1995, Brunhes-Matuyama boundary: 790 k.y. data consistent with ODP Leg 130 oxygen isotope records based on fit to Milankovitch template: Geophysical Research Letters, v. 22, p. 1525-1528.
Blackman, R. B., and Tukey, J. W., 1958, The measurement of power spectra: Dover, New York, 190 p.
Imbrie, J., and 18 others, 1993, On the structure and origin of major glaciation cycles: 2. The 100,000-year cycle: Paleoceanography, v. 8, p. 699-735.
MacDonald, G. J., 1989, Spectral analysis of time series generated by nonlinear processes: Reviews of Geophysics, v. 27, p. 449-469.
MacDonald, G. J., 1990, Global climate change, in MacDonald, G., and Sertorio, L., eds., Global Climate and Ecosystem Change: New York, Plenum Press, p. 1-95.
MacDonald, G. J., and Muller, R. A., 1994, Bispectral fingerprint identifies 100 k.y. climate cycle: orbital inclination: Lawrence Berkeley Laboratory report LBL-36214.
Muller, R. A., and MacDonald, G.J., 1995, Glacial cycles and orbital inclination: Nature, v. 377, p. 107-108.
Muller, R.A., and MacDonald, G.J., 1996, "Spectrum of 100 kyr Glacial Cycle: Orbital Inclination, Not Eccentricity," Proceedings of the Conference on Carbon Dioxide and Climate, Irvine California, Proc. Nat. Acad. Sci. U.S.A., in press.
Neeman, B., 1993, Orbital Tuning of Paleoclimatic Records: a Reassessment, Lawrence Berkeley Laboratory Report LBNL-39572.
Olsen, P. E., and Kent, D. V., 1996, Milankovitch climate forcing in the tropics of Pangaea during the Late Triassic: Palaeogeography, Palaeoclimatology, Palaeoecology, v. 122, 1-26.
Press, W. H., Flannery, B., Teukolsky, S., and Vetterling, W., 1993, Numerical Recipes: Cambridge, Cambridge University Press, 818 p.
Quinn, T. R., Tremaine, S., Duncan, M., 1991, A three million year integration of the Earth's orbit: Astronomical Journal, v. 101, p. 2287-2305.
Shipboard Scientific Party, 1991, Site 806, in Kroenke, L. W., Berger, W. H., Janecek, T. R., et al., Proceedings of the Ocean Drilling Project, Initial Reports, v. 130, p. 291-355.