 |
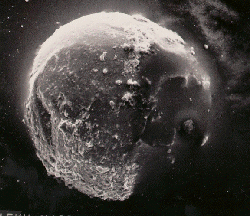
| Figure 1. SEM picture of lu09. |
Optical Observations: This spherule appeared to be shiny and black. A large chip appears to have been knocked off the side of the spherule, giving the spherule a slightly "faceted" appearance. The surface of the spherule did not appear to be terribly smooth.
SEM (Scanning Electron Microscope) Observations: The surface of the spherule appears to be relatively smooth, with a fair amount of material stuck to the sides. I can not tell whether this material is truly part of the spherule, or smaller grains adhering by static electricity. We determined the diameter of the spherule to be ~160um (micrometers). The chip seen in the optical observations may be on the lower left of figure 1.
 |
| Figure 1. SEM picture of lu09. |
Electron Microprobe Observations: The electron microprobe is able to determine the elemental compositions of the lunar spherules. These are typically presented in the form of oxide weight percentage of the various elements that we analyzed for (table 1).
| SiO2 | Fe2O3 | CaO | Al2O3 | MgO | TiO2 | Na2O | K2O | Sum | |
|---|---|---|---|---|---|---|---|---|---|
| Avg. Wht %: | 38.1 | 23.9 | 7.5 | 5.5 | 12.7 | 10.0 | 0.1 | 0.03 | 97.9 |
| Highest Con: | 39.9 | 28.5 | 9.9 | 7.3 | 30.2 | 11.2 | 0.3 | 0.06 | 99.9 |
| Lowest Con: | 33.9 | 21.4 | 0.9 | 1.4 | 8.6 | 5.1 | 0.0 | 0.01 | 95.8 |
| Stndrd Dev: | 0.7 | 0.6 | 0.9 | 0.5 | 1.9 | 0.5 | 0.0 | 0.01 | 0.6 |
| % Stndrd Dev: | 1.7 | 2.6 | 11.7 | 8.8 | 15.3 | 5.4 | 24.8 | 30.7 | 0.6 |
| Table 1. Average weight percent, high and low concentrations, standard deviation and percent deviation of elements in lunar spherule #9. | |||||||||
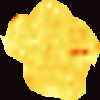
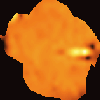
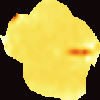
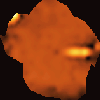
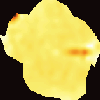
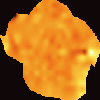
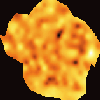
We also have produced elemental "maps" of the spherule (figure 2). In these maps the color intensity represents the concentration of a given element (so, light colors represent high concentrations and dark colors represent low concentrations. Unfortunately, we have not been able to produce good scales for these pictures, although we are working on it. To get a sense of the scale of each picture, look at the average and high and low concentrations given in table 1, above.
 |
 |
 |
 |
| SiO2 | Fe2O3 | CaO | Al2O3 |
 |
 |
 |
 |
| MgO | TiO2 | Na2O | K2O |
| Figure 2. Elemental "maps" of spherule #9. | |||
|---|---|---|---|
Note the odd blob in figure two. The blob runs from left to right and is in the left half of the spherules, almost at the "equator." This blob could be a bit of the original impactor (note the high iron concentration) or it could be a fragment of a grain that was incorporated into the spherule. If the blob was partially melted it would be called a schlieren.
One reason for chosing this spherule is that the composition of the spherule is homogenus. When you plot the concentration of silicon dioxide versus the other elements we analyzed you can get a sense of this (figure 3).
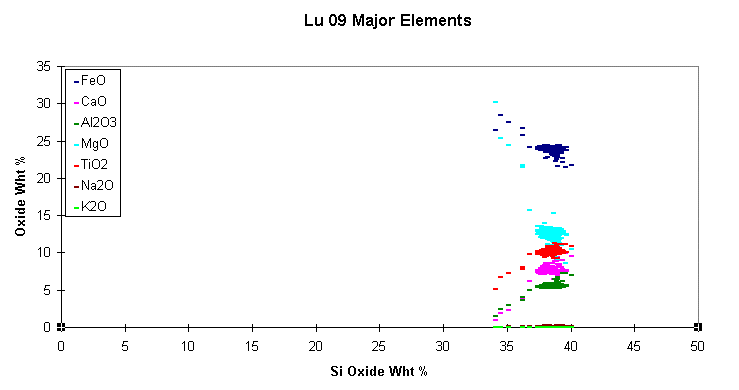 |
| Figure 3. Silicon dioxide weight percent versus other elements (in weight percent). |
The tails to the left of the main concentration of the various elements represent mixing lines between the composition of the main glass in the spherules and the blob seen in figure 2.